Possible pressures on the public debt
In the previous Note, we considered the relationship between nominal GDP growth, the fiscal deficit, and the evolution of the debt/GDP ratio. We noted that the math only works if the deficit accurately and truly reflects all the pressures on the stock of debt. In this Note, we can look at this issue in more detail with past data for Greece from 1995-2017.
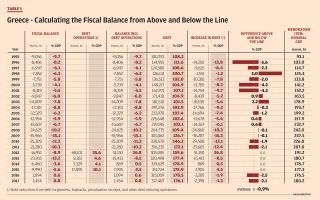
Data from Greece’s statistical office ELSTAT and the European Union’s Eurostat are in Table 1. The first column shows the fiscal balance of the general government according to ESA 2010 accounting agreements among EU countries – this is the “reported” deficit. This balance reflects all revenue minus all expenditure, and economists often refer to this deficit as measured “above the line.” The numbers show that there has been a continuous substantial deficit, except for 2016 and 2017, when the government reported a small surplus.
We can then consider the fourth column that presents the level of gross debt (in millions of euros and in percent of GDP). This shows that debt has never been below 100 percent of GDP over this period, it peaked at 178.9 percent in 2014, and then fell slightly by 2017. The column after the debt stock shows by how much the debt increased each year in euros and as a percent of GDP.
This is an alternative way of measuring the deficit, what was called the “true” deficit in the previous Note. We may consider this as a measure of the deficit measured from “below the line.” The “true” deficit always maps directly to the stock of debt; the reported deficit often does not map directly to the stock of debt.
We can now compare the deficit calculations from “above the line” (reported) with those from “below the line” (true). If the “above-the-line” deficit includes all debt-creating operations, then it will be exactly equal to the deficit measured from “below the line.” Since Greece is endeavoring to lower the debt ratio as a priority of fiscal management, the completeness of the reported deficit is therefore of utmost importance. The reported deficit is important for international comparison, but given Greece’s policy priority to get the debt down, the more critical variable for Greece itself is the “true” deficit.
If we compare the two deficit estimates, they are not the same in most years. There are some obvious reasons why this may be the case. Consider, for example, what happens if Greece receives a debt forgiveness. Then the debt stock goes down, but this amount is not reflected in the reported deficit “above the line” because Greece did not increase revenue or cut expenditure to pay back this debt. The reduction resulted from an unrequited transfer from the rest of the world to Greece; it was a gift, or a type of subsidy that Greece does not need to pay back.
There was a huge debt forgiveness for Greece in 2012 (the so-called PSI) and that shows clearly in the numbers because the debt stock dropped suddenly by a very large amount without a corresponding “surplus” above the line. Another reason why the debt stock can fall without a fiscal surplus is that the government receives from its eurozone partners cheaper new debt that can be used to buy back more expensive old debt. The gain on this transaction, too, is equivalent to a form of debt restructuring, or subsidy, that Greece does not need to pay back – hence another form of unrequited transfers from the rest of the world to Greece.
A third possibility to lower the debt without increasing the surplus is to sell assets that belong to the Greek state and use the proceeds to pay off the debt. This is a balance sheet operation (reducing assets and liabilities at the same time) that is not recorded in the “above-the-line” balance. Sometimes, the debt goes up without a deficit above the line. An example of that is when the government decides to help the banks, as during the PSI in 2012, or the government buys equity in any company – then the debt increases without a corresponding deficit above the line.
Finally, paying off arrears, or boosting the government’s stock of deposits, may require new debt as well, but these operations also are not reflected in the above-the-line deficit. The bottom line is that there are a number of reasons why the debt stock may vary in an amount that is different from the “reported” deficit. This feature is sometimes called the “stock-flow discrepancy” and both ways to measure the deficit have merit; the trick is to explain this discrepancy.
ELSTAT publishes reporting tables to explain the stock-flow discrepancy; these are referred to as reporting on the Excessive Deficit Procedure (EDP tables). These tables show that in the period 2012-2015, there were a number of unusual operations, such as the PSI in 2012, that caused large discrepancies in the above-the-line and below-the-line deficits. Of course these were the peak of the crisis years, and the eurozone partners were very active to assist Greece with unusual operations during this period.
As a result, I have created in the second column in Table 1 a “catch-all” adjustment for the size of these “debt operations.” I should stress that these are my deliberate short-cut adjustments to remove outliers in the stock-flow discrepancy in these years in the data; the government will have more precise data that could reduce this discrepancy. Outside of crisis situations, one would expect that the stock-flow discrepancy varies around zero, with some years up and others down, but no significant drift in one direction or the other.
After having neutralized the outlier crisis years in the stock-flow discrepancy, we can now summarize if the two deficit calculations give the same result over the longer run: Does the “adjusted deficit” add up to the variation in the debt? The answer is in the penultimate column that presents the remaining discrepancies in percent of GDP. The reader can see that the years 2012-2015 have been set to zero for the discrepancy, accepting that these were unusual years.
Nevertheless, the data suggest that Greece still generates more debt than is reported by the deficit, even the adjusted deficit where we have tried to account for the stock-flow discrepancy. Normally, over the longer run, there should be no drift in the debt over and above the reported deficits, but here we find that there seem to be some operations in the public sector that are not captured in the deficit calculations. This leads over time to misleading signals (too optimistic) on fiscal performance.
The remaining discrepancy column suggests that during the period 1995-2017, the debt increased (drifted) by over 19 percent of GDP in excess of that indicated by the reported headline deficit. This is the equivalent of nearly 1 percent of GDP a year on average. This is a large amount, given that we derived in the previous Note that the “true” deficit should remain below 1.5 percent of GDP to bring the debt down to 60 percent in the long run. An error in measurement of 1 percent of GDP a year relative to a ceiling on the “true” deficit of 1.5 percent of GDP a year is large and draws attention (1).
For instance, if we look at the last two years 2016-2017, the government reports a surplus of 0.6 and 0.8 percent of GDP, respectively (above the line), but the debt went up in both years. As measured from the debt stock (below the line), the fiscal balance would have been recorded as a deficit of 1.9 and 1.3 percent of GDP, respectively.
The ceiling of 1.5 percent of GDP that we suggested in the previous Note for Discussion refers to the calculation “below the line” from the stock of debt. Thus, in 2016, this ceiling was exceeded and fiscal policy was too loose, notwithstanding a reported headline surplus, and in 2017 it was barely achieved, even though the economy was benefiting from a better cycle and a strongly supportive external environment. The debt should not continue to go up if you have surpluses.
Closing thoughts
– This Note considered measurement complications in fiscal and debt analysis. The overall fiscal balance often does not directly map to the variation in gross debt. Besides debt management operations and variations in deposits that can explain a stock-flow discrepancy, are there fiscal operations that are missing in the headline deficit reports? Preliminary calculations suggest that there are such operations because the debt displays drift, and thus the reported fiscal balance is often not the true fiscal balance.
– When we project the debt in the future, should we build in a cushion of 1 percent of GDP a year in “non-reported” fiscal operations that lead to debt accumulation, over and above the projected fiscal balance, to make sure that we capture the “true” deficit that maps to the debt?
In the next Note, we will consider what other pressures could increase the debt in the future, besides non-reported fiscal activity. Two candidates that can pressure the debt are interest rate normalization on the public debt, and population aging.
(1) Separately, I have carefully checked the EDP tables explaining the stock-flow discrepancy for the period 2007-2017, but this did not alter the conclusions.
Bob Traa is an independent economist. This is the tenth in a series of articles by him for Kathimerini titled “Notes for Discussion – Essays on the Greek Macroeconomy.”