The public sector balance sheet – 2009 version

In previous Notes regarding state-owned enterprises and other assets that belong to all citizens, I advocated for the government to compile a public sector balance sheet. Such a balance sheet would record all debts and other obligations, which we may call in the aggregate “liabilities,” and also all the things that the public sector owns, which we may call in the aggregate “assets,” no matter what form these take. This is elementary accounting for any private enterprise, and there is no reason why a government should not do the same for its stakeholders, the citizens, on whose behalf the government carries out its duties.
Slowly, governments around the world are starting to compile public sector balance sheets and they are learning what information one can glean from such an accounting statement for public policy. Let me provide an intuitive argument why I think this idea cannot be stopped or resisted as time goes on. Think of any person as they manage their life. They have a period of learning and studying, then they get a job and save some money for their retirement, and then they retire and focus their mind on other, perhaps, more philosophical issues. When they retire, they draw on the savings they have accumulated during their working years. Their savings have become the assets that are available on their balance sheet for when they get older.
What every person does, intuitively, in their lives is think of what economists call a lifecycle. And every person, intuitively, composes a balance sheet to help them navigate the uncertainties and lifecycle eventualities that may come. Some people do this conscientiously and actually write down and monitor their own household balance sheet for this very purpose.
Now, states and governments – the public sector in other words – also implicitly do this, but few governments write down what the status of the balance sheet of the public sector is. That is a mistake. Politicians make all sorts of promises under the welfare system that citizens can count on benefits and assistance when they get sick and when they retire. But do the politicians project and disclose whether the government has saved enough money over time to fulfill these promises as the population gets older and retires? Almost never. Thus, now that demographic transition is at the door and now that aging of the population is pressing upon us, more and more analysts are discovering that a public sector balance sheet, including accounting for the promises under the welfare state, should be properly prepared to see if the citizens need to be reassured or if there is reason for worry and modification of some public policies. This is especially informative for Greece’s young people, because they will have to pay the bills that current policy-makers leave behind.
In other words, to gain deeper insight into the financial well-being of the public sector, a budget of revenue and expenditures, complimented with a number for the debt, is not enough. Governments need to account for everything and disclose everything, and the premier summary statement of the wealth of a public sector is the public sector balance sheet. Public sector balance sheets are overdue.
The first step to make a public sector balance sheet is for the political system to agree that it is important, and then to make a commitment to prepare one and update it regularly. Preparing one for the first time is a large undertaking that will take time, because balance sheets are data intensive. Needless to say, making balance sheets with false numbers is lunacy, so the quality of the data also will constantly need to be improved. But all of this is intuitive and the government should feel comfortable to complete this job in stages and demonstrate that every time the public sector balance sheet is updated, the document is more complete and of higher quality. If the citizens derive confidence that the exercise is on the right track, the benefits from it will quickly accumulate. Starting off with a preliminary and simple balance sheet is reasonable.
In 2009, I made such a preliminary public sector balance sheet, compiled with information that was then available. My innovation was not to attempt to make a preliminary public sector balance sheet per se, but rather to make it “intertemporal.” This means that besides adding up the assets and liabilities that I could find from the past (normal in any accounting balance sheet), I also entered a number for the expected net costs of promises under the welfare state for the future, at current prices or so-called net present value (NPV), going forward for the next 60 years. By adding these projected costs, in NPV terms, of promises under the welfare state, the balance sheet transitioned from being an accounting balance sheet in the traditional sense to an economic intertemporal balance sheet for the purposes of public financial management.
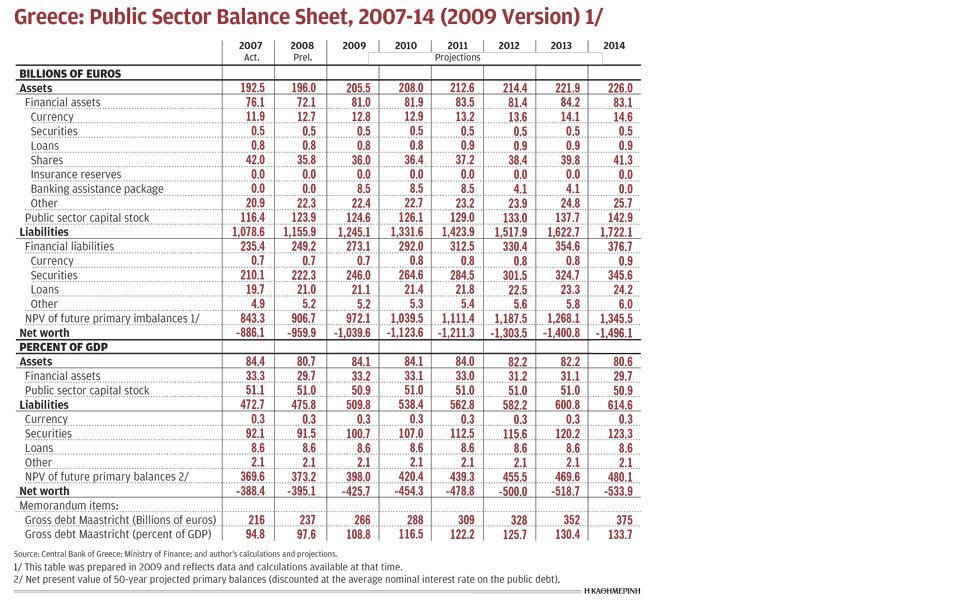
With all the information that I could gather at that time, and stating carefully all the assumptions that I had made regarding the costs of promises under the welfare state in a country that was known to be entering a period of demographic transition and aging, Table 1 summarizes this intertemporal balance sheet, including medium-term projections as of 2009.
These calculations suggested that the registered debt in 2009 was 109 percent of GDP, the public sector owned 84 percent of GDP in assets, and the NPV of promises under the welfare state were -398 percent of GDP (!) – the system as then designed had vastly larger promises to the citizens in it than was the capacity to raise revenue under existing rules. Thus, the public sector net worth was -426 percent of GDP. Any entity with such deeply negative net worth on the balance sheet, and getting worse over time, is insolvent. The full-blown crisis would officially begin in the next year, 2010.
The point of my exercise was that if the government were to have kept track of its promises to the citizens with an annually updated balance sheet, these problems would have been detected much earlier, the citizens would have been better prepared, and, no doubt, would have taken measures much earlier to prevent the worst of the crisis that was to unfold. It shows that having proper financial statements is essential, not just for companies and households, but also for the public sector.
I can say a few words about how this balance sheet was constructed. The Bank of Greece regularly publishes annual data on the financial statements of sectors of the economy, and this includes the general government. These financial statements of the general government, using data at the end of each year, show only the financial items on the balance sheet. In this case, in Table 1, those are the financial assets and financial liabilities and their respective breakdown into several important components. But this is a far cry from the overall relevant public sector balance sheet, because it says nothing about the size of the public sector capital stock, nor about net liabilities from having made promises under the welfare state on future entitlements.
Some governments systematically publish estimates of the public sector capital stock, but as far as I am aware, the government of Greece does not. So, I had to construct my own preliminary estimate. This was done using the “perpetual inventory method,” which is the workhorse for such calculations. The PIM takes a view on the capital stock in the past, based on some priors or compared to findings in other countries, and then adds every year the new gross capital investments in the budget, and deducts a portion from the pre-existing capital stock for depreciation and obsolescence. Thus, the capital stock each year increases with new investment added, and declines with a charge for depreciation – in this case I used a depreciation rate of 5 percent each year. Over time, this rolling estimate of the capital stock tends to stabilize at a certain percent of GDP. In many industrial countries, economists find that the public sector capital stock is between 40-60 percent of GDP (around 50 percent of GDP), and my calculations for Greece also fell within these boundaries.
If we take the financial balance sheet published by the Bank of Greece and we add an estimate of the public sector capital stock on the asset side, then we can get a first glimpse of the accounting balance sheet. By this I mean the balance sheet updated through today – using only past data, no projections. This is the most standard balance sheet. The net worth thus obtained tells us something about the balance between registered assets and liabilities built up in the past. In the case of Greece, this balance, or net worth, was slightly negative (around -20 percent of GDP) and gradually deteriorating. A private company would be in trouble if net worth is negative, but it does happen temporarily in special circumstances, and then the company needs to recover to a positive net worth or it will go out of business. Countries never go out of business, even if they are insolvent.
To obtain the full intertemporal balance sheet that I was interested in, I had to calculate projections for the primary balance going forward 50 years into the future (the horizon of the demographic projections at that time). This is of course a scenario, informed by demographic transition, and not a hard prediction of what exactly would happen, but my view is that scenario analysis is a vital element of good management to see what moving parts are important and which one can discount to get a sense of risks going forward. One should then stay flexible and adapt the calculations, say once a year, as a new budget comes out and a new year of national accounts is delivered; perhaps the demographic projections are also updated, etc. Thus, the projections are liable to change over time, but it is the underlying dynamics and the insight these provide that are so important to recognize how macroeconomies evolve over time.
Adding the NPV of a stream of projected future primary balances is unusual and is not endorsed by accounting standards unless in special cases. For instance, a private life insurance company or pension company selling savings policies to the public is obliged by law to keep adequate reserves, so that when the policyholders draw on the policies, the companies can meet the required payments. Political systems make promises under the welfare state willy-nilly, but do not calculate nor disclose the full costs of their promises and do not demonstrate a reserve account on the public sector balance sheet. Thus, my intent was to calculate the implications of policy promises and then place a charge for the NPV of future costs of these policies on the balance sheet. In a way, I treat the financial implications of political promises as a “debt to the citizens” or at least as a “liability” that needs to be quantified and disclosed on the public sector balance sheet so that the citizens know what is coming.
This dynamic future charge on the balance sheet is where the big action is. As of 2009, policies did not even come close to meeting future promises under the welfare state. It is good for the citizens to know this, because something has to give. And if policy is not adapted to achieve a soft landing for this problem, then Mother Nature will intervene at some point and force a hard landing. This is called an “economic crisis,” and some pretend that this comes out of the blue – it does not.
The European Union and many other countries and regions are placing renewed focus on aging. As a result, the EU has a three-year cycle where it calculates the implied costs of aging and policies to address its attendant challenges. This results in a report called the fiscal sustainability report. The EU then calculates an indicator of mismatch between policy needs and policy promises which is called the primary balance gap, or “S1” and “S2” indicators. In short, these provide information about how much the fiscal policy of any country needs to be strengthened to meet promises for the future. The intertemporal balance sheet that I propose is one version of telling the same tale. There are also very demanding “intergenerational computable general-equilibrium accounting models” that come to the same conclusions. Recognition among the broader public of this vital work is growing, because populations are aging and one asks oneself if the government is well-prepared and can pay.
In the next Note for Discussion I will update the intertemporal public sector balance sheet of Table 1 from 2009 for a new version as of 2018 with the new numbers and projections that have been developed in previous editions of this Discussion series. The results may surprise some readers. Greece has endured much stress during the crisis, but the calculations for the balance sheet as of 2018 suggest that much has been achieved. The new version of the balance sheet will inform us where Greece stands as of 2018 and what it may expect. The policy choices that the Greek governments is making every day will continue to influence how this intertemporal public sector balance sheet evolves.
Bob Traa is an independent economist. This is the 22nd in a series of articles by him for Kathimerini titled “Notes for Discussion – Essays on the Greek Macroeconomy.”


