Map drafted by Turkey in 1970s challenges ‘gray zones’ narrative
Turkey often cites the treaties of Lausanne and Paris, claiming that there are gaps in their provisions which create ambiguity. This has given rise to theories about so-called “gray zones,” which refer to islands and islets whose sovereignty, Ankara says, is not clear. Such a position, however, is relatively new for Turkey, which had a completely different approach just a few decades ago.
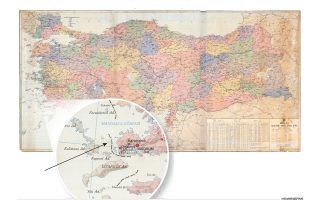
Evidence of this shift in stance is provided by a map from the early 1970s that was acquired by Kathimerini recently. Maps such as this were displayed at every public service and school in the country, and they had been created by Turkey’s General Directorate of Mapping using information and data provided by the Interior Ministry. The source reference of this particular map actually mentions that it was “designed in cooperation with the Turkish Ministry of the Interior and the General Directorate of Mapping,” and outlines the country’s “administrative regions.”
In this map, Turkey, whose boundaries are indicated with a dashed line, has itself outlined the border between the Greek islands and the Turkish coast. Greek islands that have often been referred to by Turkish officials expounding on the “gray zones” theory are depicted by Turkey’s Interior Ministry in this map as Greek. Among these is the islet cluster of Imia, which is shown within Greek territory, as are the Kastellorizo cluster and many other islands. With this map, Ankara is in compliance with the international agreements it is a signatory to.
The agreements are explicit on the issue of the sovereignty of the Greek islands and this map serves as further proof of Turkey’s change of stance. The fact that the government and its mapping service thus marked the border between the Turkish coast and the Greek islands, on the basis of their own data, makes it clear that there is no merit to Turkey’s relatively recent discussion about “gray zones” in the Aegean, as the stipulations of the treaties are already on the record.
Ankara’s foreign policy shift began in 1973, when it started “inventing” various gaps in the treaties to gradually express several baseless theories.
The maps that are posted in Turkish schools and public services today no longer contain the old dashed lines, but have colors that are often the same between certain Turkish cities and towns and Greek islands.
In the early years of this policy shift and Turkey’s new approach in the 1980s, and up until the new maps were drawn up and distributed, teachers and professors at schools and universities would ask their students to scribble out the dashed lines defining Turkey’s border in the Aegean.
One small detail about the 1970s map that is striking is its reference to the size of the Turkish population. In 1965, the Turkish population is reported as standing at 31,391,421, while today that figure is more than 83 million.