Update on the quarterly national accounts: The components of aggregate demand
The national accounts can be analyzed in three different dimensions. Each is of interest, because each tells a story about the structure of the economy. These three dimensions are: (1) value added from the production side, (2) value added from the aggregate demand side and (3) value added from the income side. Let’s have a look.
Gross domestic product from the production side is normally how GDP is measured in the first place. The authorities take measurements from many different angles and from all sectors in the economy and ask them, in essence: How much did you produce in this quarter or in this year? Thus, the agricultural sector and the mining sector, industry, tourism, health and the panoply of sectors operating in the economy will provide data on how much they produced, measured in terms of value added (we need not enter into technical details here how this is done). By totting up all the sectors combined, we get an estimate of the nation’s GDP. This is considered in almost every country as the most reliable way of measuring the size of the economy and, therefore, GDP from the production side tends to be the benchmark for GDP measurement.
GDP from the aggregate demand side asks the question: If we know how much is produced in one year, can we tell how this output is utilized on the demand side? There are five components of interest: (1) domestic consumption, (2) domestic gross fixed investment, (3) net storage or the buildup or drawdown of inventories and (4) external demand for output or exports. If total production in one year is less than the total demand for goods and services from the first four factors noted above, then the country needs to bring in the difference from abroad, and that is why (5) imports need to be deducted from total demand, because that is demand that cannot be satisfied with domestic output. Thus, GDP from the production side (who produces what) and from the aggregate demand side (who uses this output) is exactly the same.
Then, there is a third way of analyzing GDP and that is GDP from the income side. This asks the question: If output is produced and factors of production are paid salaries, wages and profits for their efforts, how is the income generated by producing GDP distributed? Here we have three items: (1) compensation of labor, (2) compensation of capital or operating surplus and (3) indirect taxes minus subsidies. Indirect taxes are value-added taxes that the government collects and that thus cannot be distributed either to labor or capital. The government also creates subsidies (a government expense) to the factors of labor and capital, so these need to be subtracted from the value-added taxes collected. Roughly speaking, the income or value added in GDP is distributed to labor, capital, and the government. All three measures of analyzing GDP add up to the same GDP number.
In this Note, we look at the Hellenic Statistical Authority’s (ELSTAT) report of the quarterly national accounts from the demand side. We are interested in the structure of aggregate demand and how government policy connects to this structure. In the next Note, we will look at the income side of GDP – who earns what.
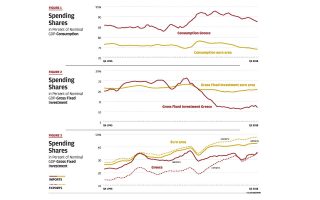
Figure 1 shows us the four-quarter moving average of the share of final consumption (by the private sector and the government combined) out of GDP. We will show for each component how Greece compares to the eurozone overall. All data are from ELSTAT and Eurostat from Q1 1995 through Q3 2018.
These figures are interesting and generate lots of ideas and hypotheses. For instance, note that consumption in Greece (around 90 percent of GDP) is much higher than in the eurozone as a whole (around 75 percent of GDP). This means that the flip side of consumption, saving, is much lower in Greece than in the eurozone as a whole. If you enjoy spending, but you are not a good saver, guess where the difference must come from: debt. But why is saving so much lower in Greece than in the eurozone?
One possible candidate is an overvalued real exchange rate. When the real exchange rate is overvalued, this provides incentives to pull in consumption from the future into the present, because consumption today is relatively cheap, compared to consumption tomorrow when the real exchange rate resets to equilibrium – i.e. falls. Another way to put this is that Greece is not quite competitive yet.
Another factor that can influence this result is the age structure of the population: Elderly populations tend to save less because their incomes tend to be lower and they have less time to exchange savings today for higher consumption tomorrow.
Another one is that high-growth countries tend to save more than low-growth countries, because income in high-growth countries “speeds up” a bit over consumption. Every period on trend, income advances and consumption catches up a bit later – this lifts contemporaneous saving. Growth in Greece is structurally slowing, which is an interactive effect with aging.
Yet another one is that the private sector, for whatever reason, may be a generous consumer and a weak saver, but then the public sector should be the stronger (structural) saver and the moderating force in consumption – to lean against the wind and keep the economy (or saving-investment) in balance. If that “offset” policy is calibrated well, then the country will not overheat, the real exchange rate will not appreciate and the economy will generate adequate saving on its own. It is fair to suspect that the Greek government has not conducted anti-cyclical nor structurally calibrating fiscal policy very well in the past.
Interested readers may come up with other reasons why Greece has such a large share of consumption. I believe that it is worth keeping an eye on this remarkable issue and ask whether policy can do something, or needs to do something, to moderate consumption. Also, note that consumption shifted up noticeably with the crisis. This surprises many people – how can you consume a larger share when the economy is in a crisis? This reflects the empirical finding that all households practice what is called “consumption smoothing.” This means that one does not vary consumption from one euro to the next, but rather prefers to keep a relatively smooth consumption pattern. When income goes down in the crisis but consumption spending is smoothed, then the share of consumption out of GDP will step up. Only later, when the economy adjusts structurally, will this ratio drift down to the longer-term trend. Notice that the eurozone also shows evidence of consumer smoothing with the slowdown in 2009.
The bottom line is that, notwithstanding the hard times perceived in Greece, the consumption appetite seems very big and this may be an impediment to saving and investment for the long-run health of the economy. Policy can change this by leaning against the wind of the private sector and running a public sector fiscal surplus. Politically, this is a tough one.
Let us look at gross fixed investment next in Figure 2. Investment in Greece and in the eurozone were relatively similar until the crisis came. Clearly Greece adjusted by cutting investment spending, which may be from domestic entrepreneurs seeing fewer opportunities and/or foreign investors suffering from weaker confidence in Greek prospects, and/or the government was running out of money and financing. Financing conditions also tightened for private firms and banks suffered, so Greece suffered a “perfect storm.” These conditions are now very slowly normalizing. If more saving were available (capital controls scare savers, they do not keep them in), either from the private sector or from government policy, then the investment climate might improve. Government regulation (e.g. depreciation rules) and intervention, including through taxation, can materially affect investment, so there is a lot of ground to cover here.
One thing is certain, the mix in Greece between consumption and investment is still highly slanted toward consumption. If investment conditions do not improve, employment opportunities will not be great either and the economy could adjust through more out-migration. Let us hope that this does not continue. Greece needs policies to bolster confidence.
Finally, Figure 3 shows the spending structure in exports and imports to GDP. Here we see various interesting pieces of information:
Greece is a relatively small economy, but it is less open than the much larger eurozone. Both exports and imports are smaller in relation to GDP than for the bigger economy. This is counterintuitive because larger economies are almost always less open and depend more on domestic demand. It suggests that Greece needs to “open up” further to foreign trade. This is once again related to government policy and competitiveness.
Greece has had a very large deficit in the past, for a very long time. This of course was financed with debt. The flow imbalance is now almost closed. Combined with the information above, the flow imbalance was not closed by boosting saving but by cutting investment. How can policy assist that investment strengthens without again triggering a large external deficit? There are many simultaneously moving parts in an economy and a deep discussion on how to solve this puzzle is important.
Greece still has a small external deficit; the eurozone has a growing external surplus. Greece has made a major improvement in export performance while imports have leveled off. Exports and investment should be a priority for future growth. How can policy contribute? One just cannot get around the importance of improving productivity and competitiveness. More consumption is not the recommended policy. Finding the right answers first means that one needs to ask and discuss the right questions.
In the next Note, we will look at GDP from the income side. It will prove fascinating, once again. Who would have thought that a system of national accounts can contain so much information? This is all about the “big picture.” We can try drilling down from these big-picture issues into the nitty-gritty and figure out what the policy implications are.
As I do above, it is helpful to monitor every quarter whether the structure of the aggregate demand components of GDP changes and why. This is valuable information to inform policy.
Bob Traa is an independent economist. This is the 16th in a series of articles by him for Kathimerini titled “Notes for Discussion – Essays on the Greek Macroeconomy.”