Annual targets can be interpolated for quarterly monitoring


In previous Notes for Discussion, we derived a long-run annual path to bring the Greek economy home to safe and sustainable conditions with debt below 60 percent of GDP. However, a long-run annual path for real and nominal GDP is quite abstract, so the question arises how one can translate such an abstract path into a quarterly monitorable one for the medium run, say five years out. It is useful for the government and the public to be able to see in the shorter run whether the “plan” is on track or not. This note will show that quarterly monitoring can be done by using the updates from the Hellenic Statistical Authority (ELSTAT) of the quarterly national accounts. In fact, the quarterly national accounts provide a wealth of information about the economy, and we will develop in several Notes for Discussion what messages we can glean from these helpful and ongoing statistics.
The long-run plan from Odysseus presented before contains annual real GDP and inflation implications for the next five or 10 years; and then another five or 10 years; and so on, until the long run is reached. We can now interpolate what quarterly path for the national accounts is consistent with “being on track” in this long-run plan, at least as far as GDP is concerned. Every time that new quarterly data come in from ELSTAT, we can check whether the plan for GDP is on track or off track and why.
If the deviation is just noise within a certain confidence band around the desired path, then we can ignore it and there is no need for path correction. However, if the quarterly results, as they roll in, present significant surprises, then a careful analysis is warranted and perhaps it suggests that the government should consider a policy reaction to bring events back on track. In any event, it is advisable that the long-run path be reviewed and retested annually with the budget round. Monitoring events at different levels of frequency develops a checking mechanism that the broader public can see and understand, and the government can then comment on actual developments so that the public stays well informed and gains confidence that the path is on track with the long-run adjustment plan.
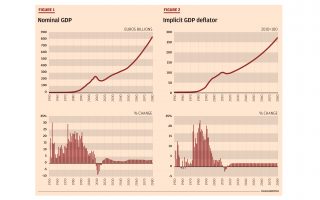
Figures 1-3 below summarize the annual path through the next decade of Odysseus’ long-run plan in the level of nominal GDP, the growth rate of real GDP, and the aspirational objective for inflation as expressed in growth in the implicit deflator. This plan was calculated based on data available through Q1-2018. We have, in the meantime, received quarterly national accounts data for Q2 and Q3 2018 from ELSTAT, and there were small updates to historical data, so we can also show what the updates tell us about the actual path so far. In figures 1-3, the original plan is shown in solid lines and columns, and the updates are shown in the dashed lines.
It is clear that in Odysseus’ plan, Greece is leaving the recession behind (Figure 1). Real GDP is seen growing by around 2 percent for some years as the rate of unemployment comes down, before the gravitational pull of slowing demographics starts limiting the growth rate (Figure 2). As was explained in the plan, the rate of inflation is seen rising to 1.75 percent a year, aimed at staying just below the eurozone average to secure needed further gains in competitiveness (Figure 3). Recent updates from ELSTAT on the quarterly national accounts suggest that real GDP developments are reasonably on track, but also that inflation is running slightly ahead of the original plan. Thus, nominal GDP is rising slightly above the original plan, so far.
Now let us see if we can develop a quarterly path for these variables consistent with the annual plan so that we can monitor at higher frequency. This path is shown in Figures 4-6 for the five-years through 2023.
The sum of the four quarters in each year delivers the annual number that is in the description above as part of the long-run annual plan.
The quarterly path for real GDP was derived from ELSTAT’s quarterly numbers from the past that were seasonally and working-day adjusted. This technique is necessary to get “clean” underlying growth rates Q/Q for real GDP. For instance, the third quarter is the big tourism quarter, so this naturally generates “seasonal” activity. To see if the growth rate from the second quarter to the third quarter is outside of the normal variation, ELSTAT presents a growth rate that is adjusted for this seasonal effect. Also, holidays sometimes fall on a weekend and sometimes on a weekday, so adjusting for this work day or calendar day variation is also needed to take out “noise” in the Q/Q growth rates.
The projections for real GDP are thus done by applying the distribution of the four quarters, as shown in the average pattern from past data, to the annual real GDP scenario in the medium term. This yields the data for the level of real activity in Figure 4 and the growth rate in Figure 5. We can then translate back to projected headline real GDP by reversing the calculations and putting back in the seasonal factors and working-day factors. That gives us a scenario for quarterly headline real GDP.
The calculations for the quarterly deflator were done in a simple way by taking the annual scenario inflation number and applying this to every quarter over the same quarter of the previous year. Hence, projected inflation in the deflator shifts up gradually in blocks of four quarters, as Figure 6 demonstrates. If there is seasonality in the previous quarterly inflation data, then applying Y/Y growth rates to the seasonal base from past observations automatically embeds the past seasonal pattern as well. These calculations can be done in a more sophisticated manner, but I have opted for a simple model here.
Now that we have a time series for quarterly real GDP and a quarterly deflator, we can construct the path for quarterly nominal GDP by combining these two.
The four quarterly results for each year add up to the annual headline real and nominal GDP and the annual deflator, so they are consistent with the annual plan projections. This means that when the quarterly data get updated, we can see whether these numbers indicate that the economy is on track with our long-run assumptions or not. As above with the annual data, the figures for quarterly data show the plan in solid black lines and columns, and the updates from the quarterly national accounts data in dashed lines. The updated quarterly numbers show real GDP again to be closely as expected on average; with inflation slightly above the plan consistent with the annual presentations shown before.
If the emerging quarterly results were to go in a different direction, after careful assessment of the error terms and why this might be happening, then the government can decide whether a course correction is necessary. By repeating this exercise every quarter, the government and the public can thus see what is happening to the economy, including relative to a desirable plan. It is also helpful to follow the quarterly projections and assessments that research offices in banks and think tanks make (e.g. National Bank, Piraeus, Alpha and Eurobank, and the Foundation for Economic & Industrial Research [IOBE]). These analyses are helpful to stay alert to developments and possible problems. Thus far, with new data from Q2 and Q3 of 2018, there does not seem to be a noticeable deviation from what Odysseus’ long-run annual plan had foreseen, so we can say that developments are broadly on track.
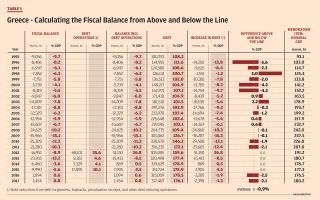
The developments in GDP is only one part of the plan; readers should also monitor developments in the public debt, which is the other side of the coin for Odysseus’ plan. Odysseus’ debt objective is extremely simple to monitor – no more increase in the level of the gross debt, in euros. It is clear from recent developments that the plan is way off track on this account. While growth is on track, the public debt, in euros, keeps increasing. The government needs to explain why it reports a surplus in the fiscal accounts and the gross debt keeps going up – this is inconsistent and means that the plan is not on track. Policy corrections are called for to bring the debt down to the level at end-2017, in euros, and keep it there.
In the next Note for Discussion, we will analyze what the national accounts updates can tell us about developments in aggregate demand components (consumption, investment, exports, and imports), and how this relates to guiding the economy safely through the plan to reduce the debt, in percent of GDP, in the long run.
Bob Traa is an independent economist. This is the 15th in a series of articles by him for Kathimerini titled “Notes for Discussion – Essays on the Greek Macroeconomy.”